1st Year of the Project / Intermediate Results Presentation
The UGESCO WebGIS lets end users explore the enriched datasets using temporal and spatial mapping tools, and study how the data evolves in time and space. The time intervals are structured within the interactive Triangular Model (TM), where each point is a time interval with the center of the interval on the x-axis and the duration on the y-axis. The WebGIS allows user to select specific objects based on different Allen relations and derivatives, and to combine them with the basis of set theory on the TM or the map. An example of the TM is shown in the figure below, which gives a spatio-temporal overview of all battles that happened before the battle of Moscow.
The WebGIS is implemented in Javascript and uses i) the Leaflet[1] library for generating the interactive maps, ii) plotly.js[2] as graphing library for the TM and iii) turf.js[3] for the advanced geospatial analysis.
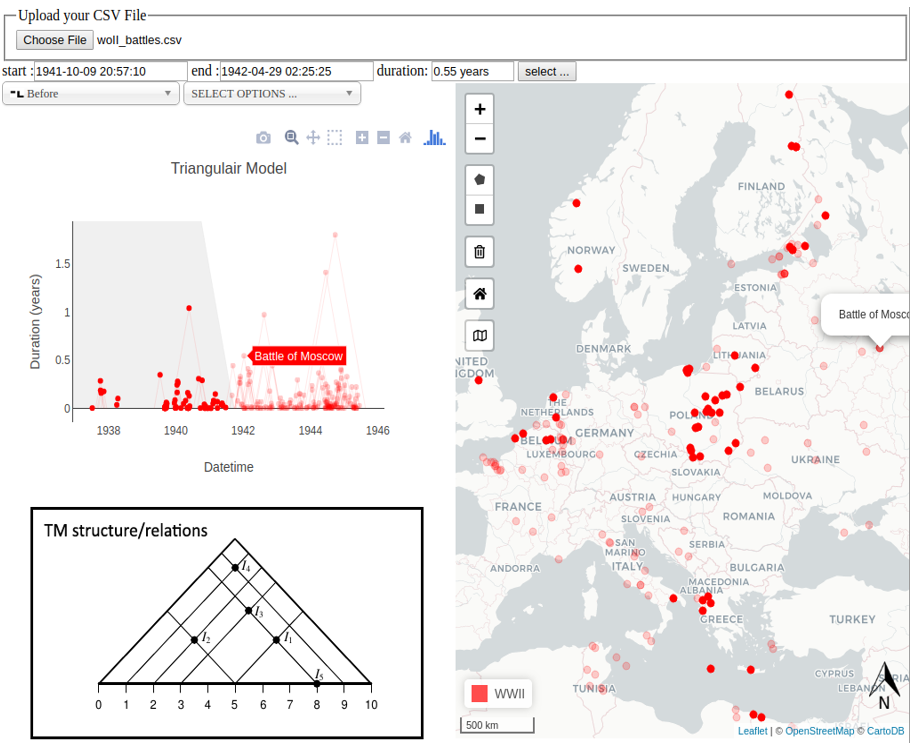
Triangular Model (TM) of battles during WWII – selection of all battles that happened before the battle of Moscow. The inset shows the TM structure and relations between points in the model.
[1] https://leafletjs.com/
[2] https://plot.ly/javascript/
[3] http://turfjs.org/